The $8,443 tuition
My model's cumulative P&L chart is the ugliest thing I publish. Here's the whole curve — the hole, what dug it, and what it cost to learn.
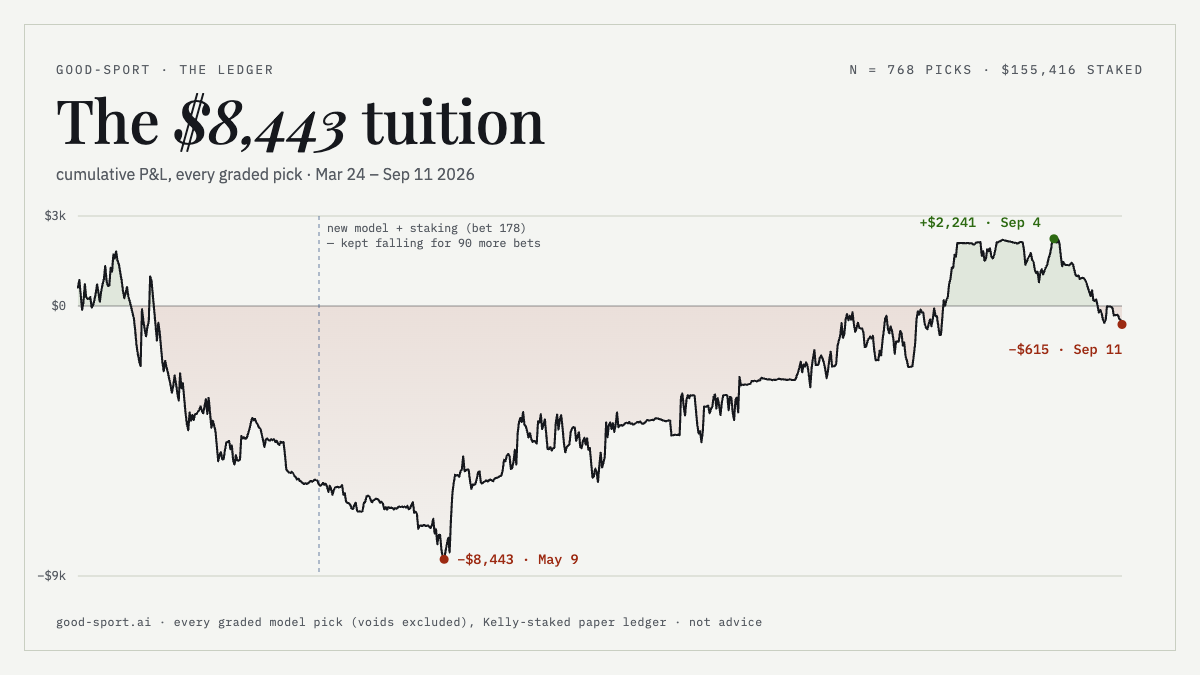
Every tout shows you a green screenshot. Here is my actual cumulative P&L curve, every graded pick since the first one on March 24: a brief lucky start, then a five-week slide to −$8,443, then four months of climbing that got all the way back to +$2,241 on September 4 — and then a week that gave it back. As I write this the line sits at −$615.
Six months of daily model-driven betting, 768 graded picks, $155,416 of tracked stakes, and the net result is slightly less than nothing. That's the honest headline, and it got worse between drafting this post and publishing it. The interesting part is what the shape of the hole taught me, because every lesson in it now has a price tag attached.
Bets 1–40: the lucky start
The first few weeks were green — up $1,819 at the peak. Tennis picks, mostly, from a freshly trained model that hadn't been stress-tested by anything. I now read that stretch as the most dangerous part of the whole curve: it looked like validation, and it was variance. If the drawdown had come first, I'd have been more careful $8,000 sooner.
Bets 40–270: the syllabus
From mid-April to May 9 the curve goes one direction. At the bottom I had lost $8,443, and here's the thing I want to be precise about: the model version wasn't the problem, and upgrading it didn't help. There's a dashed line on the chart at bet 178 where a new model and tighter staking went live. The curve fell for ninety more bets after it.
What was actually broken took until late July to prove, and it's in one table. These are the game-line picks (MLB + NHL), split by whether the model liked a favorite or an underdog:
| era | pick type | n | model claimed | actually won |
|---|---|---|---|---|
| through May | favorites (≥50%) | 137 | 61.0% | 57.7% |
| through May | underdogs (<50%) | 97 | 42.6% | 20.6% |
| June onward | favorites (≥50%) | 107 | 61.0% | 55.1% |
| June onward | underdogs (<50%) | 20 | 45.5% | 20.0% |
Read the second row. Ninety-seven underdog picks that the model priced at 42.6% to win, winning 20.6% of the time — half its claim. Every one of those "edges" was a calibration artifact: the model wasn't finding underpriced dogs, it was hallucinating them, and Kelly staking obligingly bet more on the most hallucinated ones. The favorites row, meanwhile, was roughly honest the entire time.
That asymmetry — calibrated above 50%, delusional below it — is the whole hole. The market wasn't beating my model. My model was beating itself, on exactly one side of the ledger.
Bets 270–768: the grind, and what actually changed
The climb back wasn't a smarter model. It was governance:
- Rails: minimum-edge floors, a heavy-underdog cutoff, exposure caps — mechanical filters that mostly stop the broken cohort from being bet at all.
- A calibration overhaul that treated the probability layer as the product, not the features.
- Pre-committed audit rules (written down before seeing the data they judge) that kill or keep each betting family on schedule, so the verdicts can't bend to my mood.
- And the quiet engine: the tennis model, +$7,667 on the season at +6.6% ROI across 384 picks, which paid back most of what baseball and hockey burned.
Look at that fourth table row again, though, because it's the anti-tout point: the underdog picks are still broken — 20.0% against a 45.5% claim since June, and that row got worse, not better, as more data arrived. The rails didn't fix them. They reduced them from 97 bets to 20. The honest description of my improvement is not "the model learned to price underdogs"; it's "the system learned to stop letting it try."
The honest asterisk
When I drafted this a fortnight ago the line read +$2,233 and I wrote that the August climb owed a lot to one hot tennis month, that hot months end, and that the next drawdown would test whether the rules catch it early. I did not expect to be marking my own homework quite this fast.
August tennis: +$4,578, +14.0%. September tennis: −$1,667, −17.2%. The hot month ended sixteen days after I said it would. Add a college football debut that has gone 8–14 for −$1,000 (−42.7%) and the curve is back under water at −$615 on $155,416 wagered.
Two things are true about that. The drawdown is roughly $2,800 from the September peak, not $8,443 — the rails did what they were supposed to, and the football board was flipped to report-only mid-month by a written rule rather than by my flinching. But one sport is still carrying two others (MLB lifetime −19.8%, NHL −19.9%), tennis's bad month is within ordinary variance for 51 bets, and "the system catches it early" remains a claim with one data point behind it.
What the tuition bought
The clearest return on the $8,443 isn't the recovery — it's how new sports now come aboard. College football and the NFL entered the platform this month with every scar pre-applied: validated on a held-out season with real archived odds before a dollar moves, prop families in report-only mode from birth until a pre-committed audit passes, and pipelines that page me when something silently breaks instead of smiling for a month. College football's first month of graded picks has gone 8–14 and lost $1,000 on $2,345 staked — a genuinely bad debut, which is exactly the point: it cost a nice dinner, and a written rule flipped the board to report-only in week two rather than letting it run. The new models never get to repeat bets 40 through 270. That's what the money was for.
Postscript: the next lesson arrived on schedule
Writing this, I went looking for the pricing signal that would have flagged the bad bets before they were placed — closing-line value, the number every sharp swears by. On game lines it works: the picks that lost the close ran −40%. On player props it found nothing. Legs that beat the close and legs that lost it returned the same +0.6% and −0.3%. What the study did show, in every cut, was the same gap: the model claiming 64% and hitting 55%. The loss on props isn't the price. It's the probability.
So the probability layer got what the staking layer got in May: rules. A second calibration layer now refits itself every Monday on the model's own settled bets, judged only on what it would have earned the following month — the batter-hits map it chose turns a −0.2% raw cohort into +2.5%, while the frozen map I'd fit once in June was, by September, losing 10% on the very legs it was most sure about. And where the model is most confident it is most wrong: pitcher-strikeout legs it priced at 76% hit 44%, tennis match picks it priced at 82% hit 67%. Those regions are now railed off — predicted, graded, published, and not staked. The tuition keeps buying rules. I'd rather it bought a smarter model, but the ledger keeps saying the rules are what pay.
Postscript II: the model I was grading wasn't the model that was betting
The section above says the loss is in the probability layer, not the price. That was right, and it wasn't deep enough.
The baseball model's held-out backtest says +11.2%. Its live record says −13.1%. I spent months reading that gap as calibration drift — the model being overconfident in the wild — and last week I finally went looking for it properly. It isn't drift. Eight of the model's inputs, including some of its most informative, are present in roughly 98% of the rows it trained on and absent from 100% of the rows it actually bets on. Lineup-quality features that only exist once a lineup is posted; the pipeline runs before that. Missing values get filled with the column median, so nothing errors, nothing logs, and every live prediction is made by the trained model with eight of its inputs replaced by constants.
A backtest cannot see this. It reads the same table the model trained on, where the features are present — so it faithfully measures a model that has never once made a real prediction. That reframes the whole post, and it's the next one: I found five more of the same species in the same week, and the measurement restarts today with a fixed start date. I'll publish that number in October either way.
I built good-sport as a model you can interrogate — connect it inside Claude, ChatGPT, or Grok and ask it where the edge is, how it's staked, and how often it's wrong. This ledger is the long-form version, drawdowns included. Research tool, not picks. 21+.